

Flare (FLR) Indicates Bullish Crossover, Targeting 20% Price Increase
The FLR price appears poised for additional gains in the coming days, following a confirmed bullish SMA crossover on the daily chart.
Summary
- On September 24, the FLR price reached an 8-month high of $0.028.
- The token experienced a surge following the launch of FXRP, the inaugural live application of its FAssets protocol.
- A bullish crossover has been confirmed on the daily price chart.
According to information from crypto.news, Flare (FLR) hit an 8-month peak of $0.028 on September 24 and is currently trading at $0.026. At this moment, the altcoin has risen 30% from its monthly low and boasts a staggering 136% increase from its lowest point this year.
Today’s gain in FLR aligns with a significant uptick in its daily trading volume, which indicates a rise in trader demand. Over the past 24 hours, trading volume for the token has soared by over 350%, with derivatives volume climbing 335% to reach $15.8 million, as reported by CoinGlass.
Meanwhile, open interest in the FLR futures market has surged by 23.8%. Typically, an increase in open interest alongside rising prices signifies a strong trend fueled by new liquidity.
The long/short ratio for FLR exceeds 2.4 across all major timeframes, further validating a bullish outlook, as more traders position themselves for a price surge.
A significant portion of this enthusiasm stems from the rollout of FXRP, the first live instance of its FAssets protocol. This development allows XRP holders to mint a wrapped version of the XRP token on the Flare network for use across decentralized finance platforms.
This advancement has enhanced the token’s social sentiment, according to data from Santiment, likely capturing the attention of the XRP community, which is known for actively supporting projects that increase their native asset’s utility.
On the daily chart, FLR has broken free from its trading range of $0.023-$0.025, which had persisted for the past week. This breakout indicates that bullish sentiment is gaining traction as selling pressure eases following the FXRP announcement.
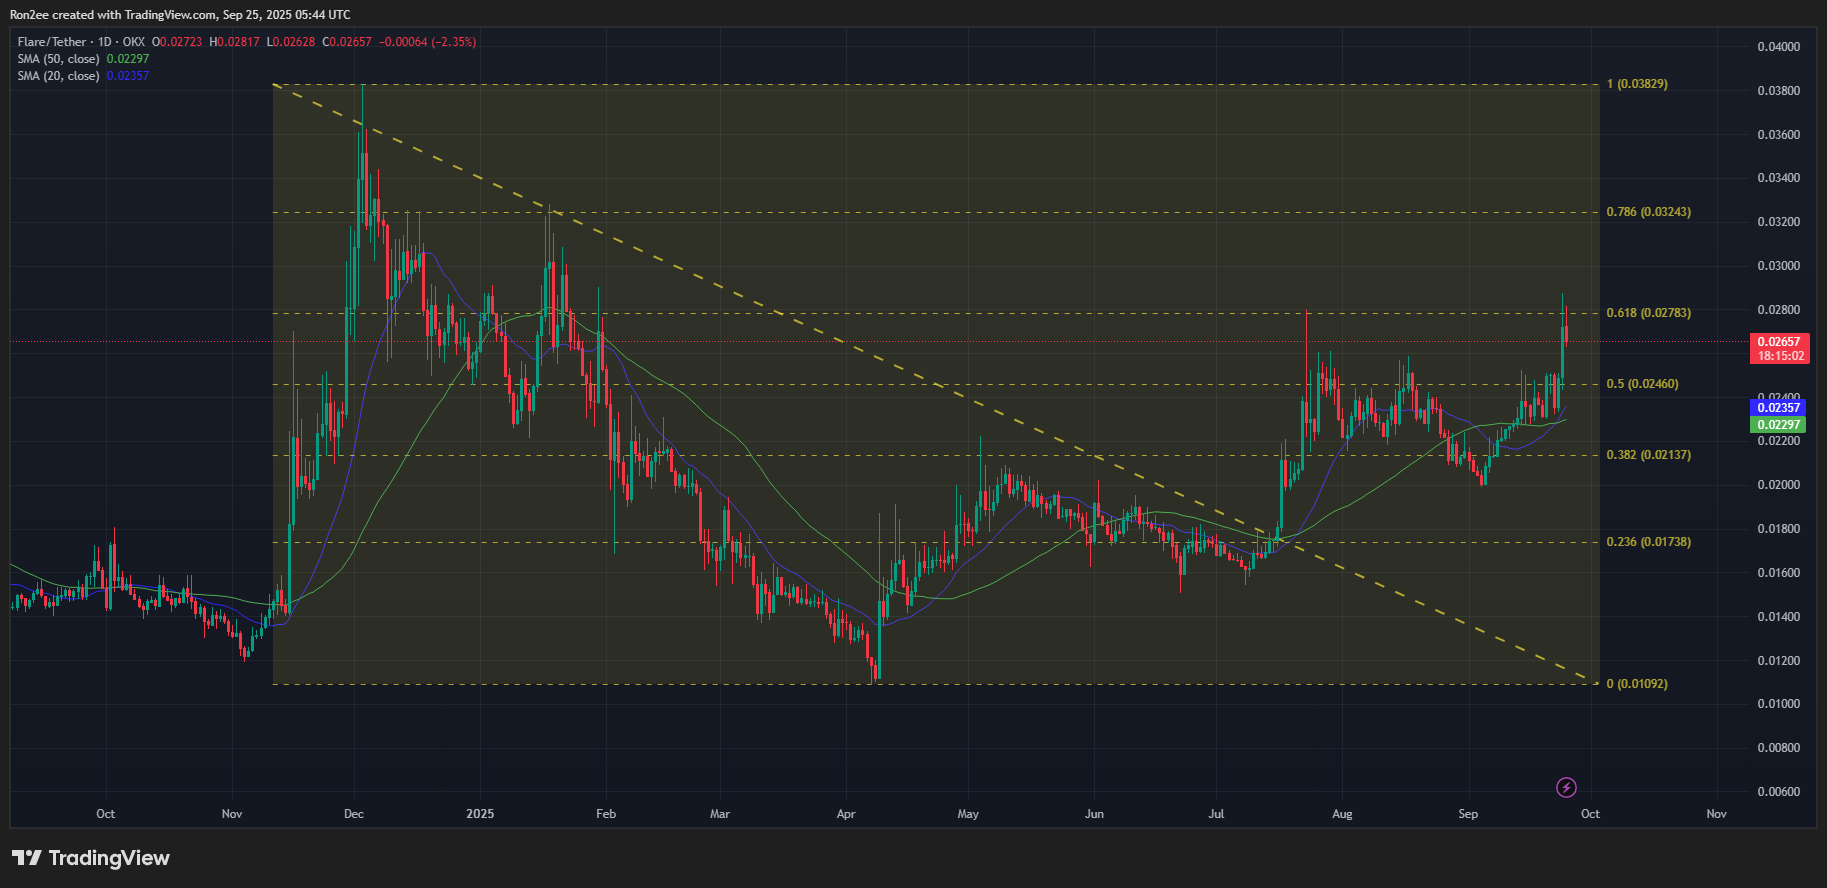
The 20-day simple moving average has now overtaken the 50-day SMA, resulting in what is recognized as a bullish crossover in technical analysis. Traders often interpret this as an early sign that the asset is shifting from consolidation to an upward trend.
Additionally, momentum indicators such as the MACD lines are trending upward. In technical analysis, this suggests that market strength is making a comeback after a phase of weakness.
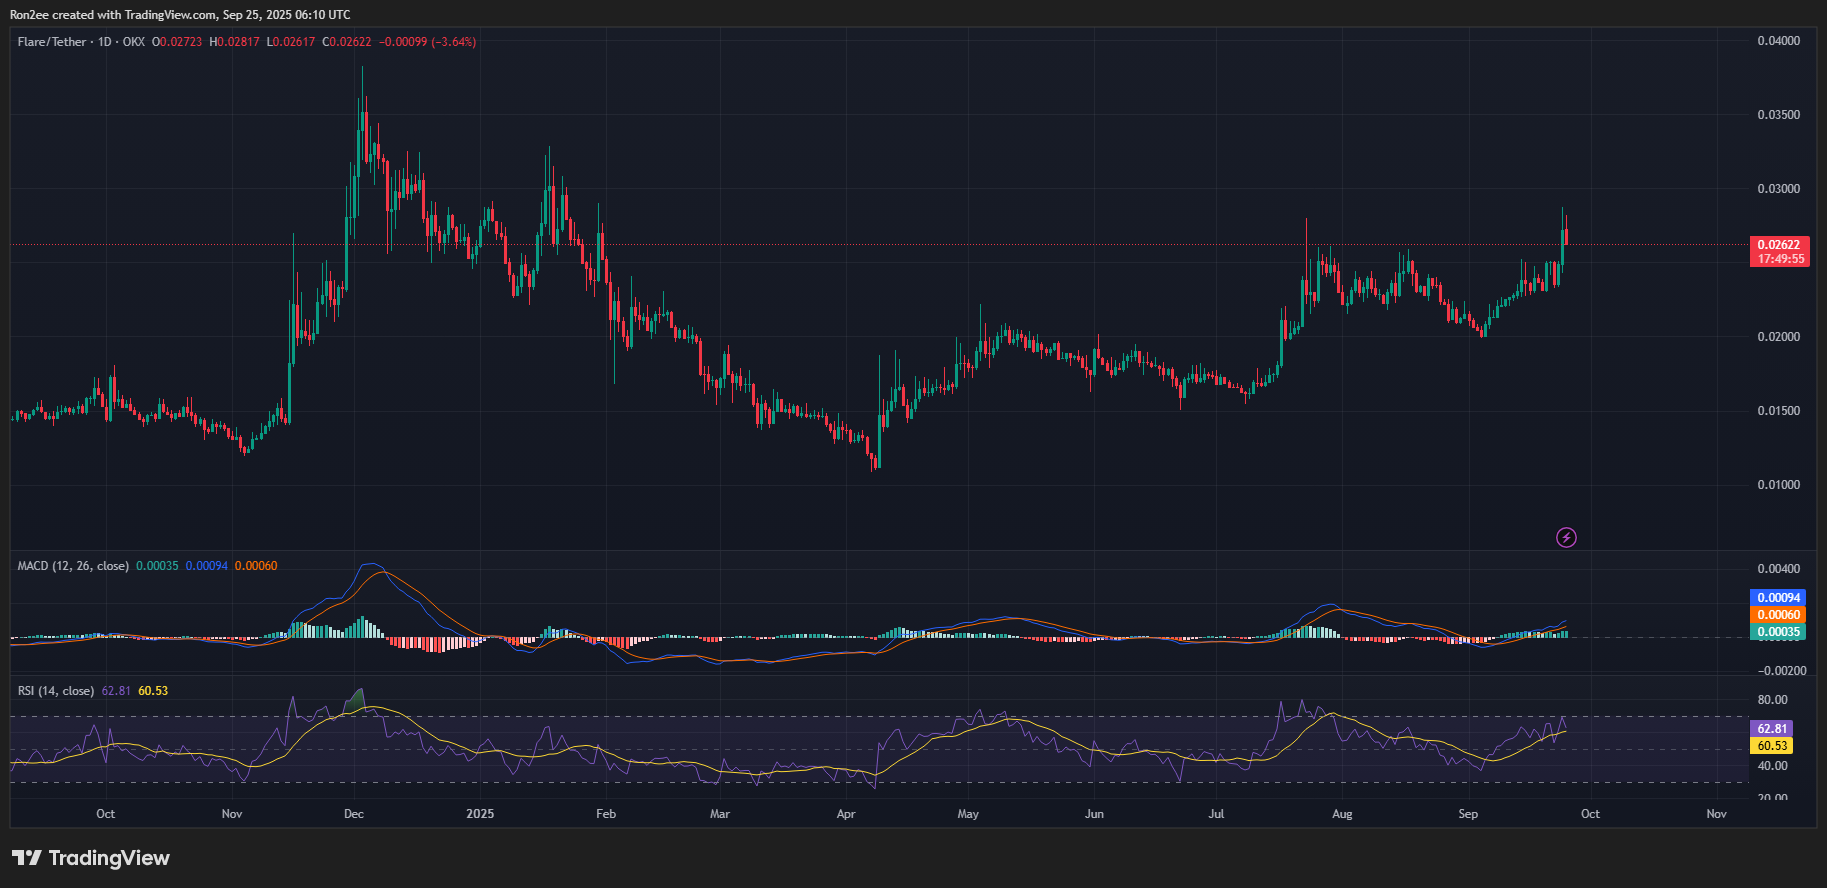
With a currently favorable community sentiment and the RSI yet to reach overbought levels, the potential for ongoing upside remains plausible in the near term.
As a result, FLR is likely to aim for $0.032, a target that aligns with the 61.8% Fibonacci retracement level, positioned 23% above the current price.
If the bullish momentum starts to decline, key support for the token can be found at $0.023, aligning with its 20-day SMA.
Disclosure: This article does not serve as investment advice. The information and materials presented on this page are solely for educational purposes.


