

From Freefall to Recovery: The Impact of the Trade War on Markets
XRP, the cryptocurrency powering the XRP Ledger (Ripple protocol), experienced a sharp decline on Friday, Oct. 10, reaching its lowest level since December.
Summary
- Ripple’s XRP token has dropped 63% from its annual peak, falling to $1.37 before bouncing back by 75%, resulting in $700 million in liquidations and validating chartist Peter Brandt’s bearish projection.
- This decline coincided with a $300 billion sell-off within the crypto market, attributed to rising trade tensions between the U.S. and China.
- Even though XRP has stabilized—supported by ETF inflows and expected new approvals—analysts warn that volatility may persist as technical indicators suggest both risks and potential recovery.
XRP Price Decline Confirms Analyst Forecast
The Ripple (XRP) token reached a low of $1.3758, translating to a decline of over 63% from its yearly high. This steep drop resulted in a $700 million liquidation event.
In the aftermath of the crash, XRP’s price rebounded by more than 75% as investors seized the chance to enter at lower levels. This recovery was in line with analyst Peter Brandt’s caution on X: “On the left, you see a typical descending triangle from Edwards and Magee, illustrating what these triangles indicate. On the right is a developing descending triangle. ONLY IF it closes below 2.68743 (then I’ll be critical), should it drop to 2.22163.”
Brandt had set a target of $2.2, which was reached during the larger market crash on Friday.
The cryptocurrency market faced significant losses as investors reacted to rising trade conflicts between the U.S. and China. Trump announced a 130% tariff on Chinese products, with China likely to respond with retaliatory measures.
The U.S. president highlighted recent actions by Beijing, including a ban on soybean imports from the U.S., new tariffs on American vessels in Chinese ports, investigations into U.S. tech firms, and restrictions on rare earth exports.
The market crash in crypto resulted in losses exceeding $300 billion, with total market capitalization plummeting to $3.7 trillion. Liquidations within the crypto sector reached nearly $20 billion.
Nonetheless, XRP possesses several potential recovery catalysts, such as ongoing ETF inflows and anticipated approvals of spot ETFs. Data from ETF.com suggests that the XXRP, UXRP, and XRPR ETFs have experienced substantial inflows since their recent approvals.
Technical Analysis of Ripple Price
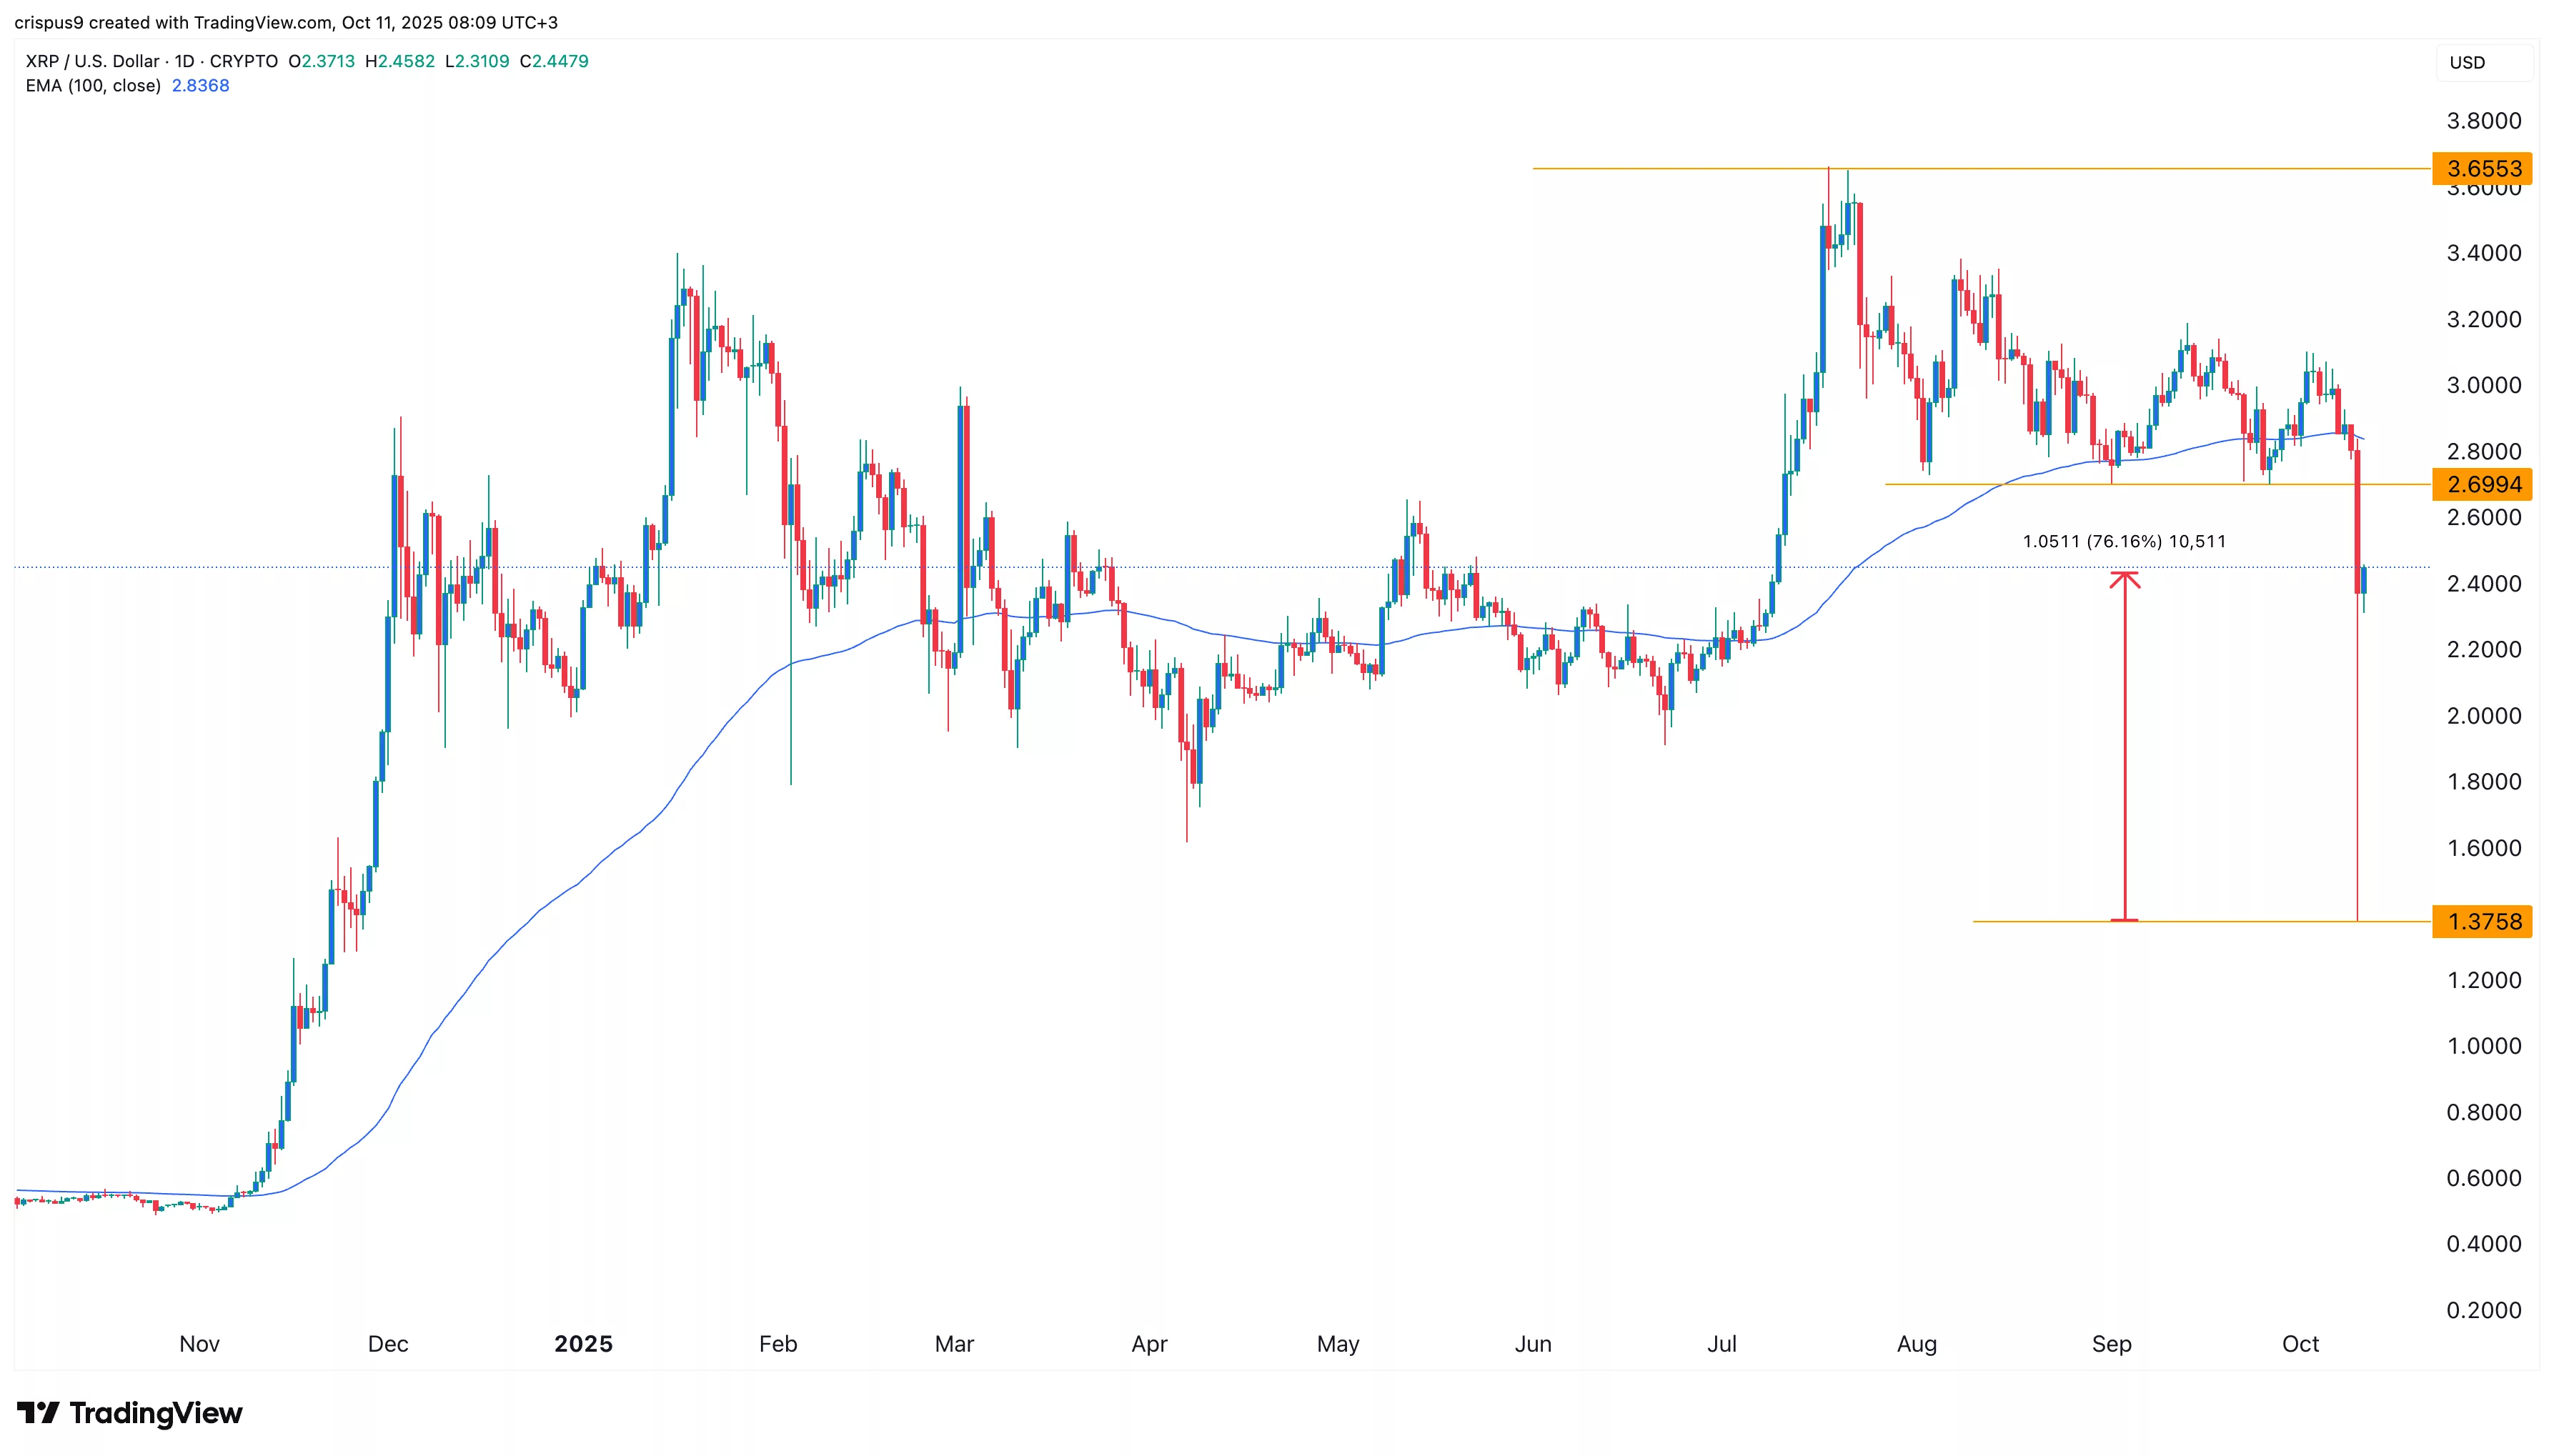
The daily chart indicates that XRP peaked at $3.6553 in July before dropping to a low of $1.3758 on Friday. This decline followed the formation of a descending triangle pattern, a well-known bearish indicator.
This drop also invalidated other bullish formations, such as the falling wedge, bullish flag, and cup-and-handle patterns. XRP fell below the 50-day and 100-day Exponential Moving Averages.
On a more favorable note, the asset has developed a large hammer candlestick pattern—recognized as one of the most significant bullish reversal signals in technical analysis.
As a result, it appears that XRP’s price will continue to be volatile as trade tensions grow. It might rebound and test the resistance at $2.70 before resuming its downward trend in the near term.