Meme Mania: ETF Inflows Propel 86% Surge
Solana is currently witnessing a surge of momentum, fueled by both Wall Street investment and the enthusiasm of meme coin fans.
With the recently introduced REX-Osprey SOL + Staking ETF (SSK) nearing $100 million in assets and offering unique staking rewards, institutional interest is markedly increasing. Alongside a meme-driven rally and favorable technical indicators, it’s no wonder that SOL has just hit a multi-month record.
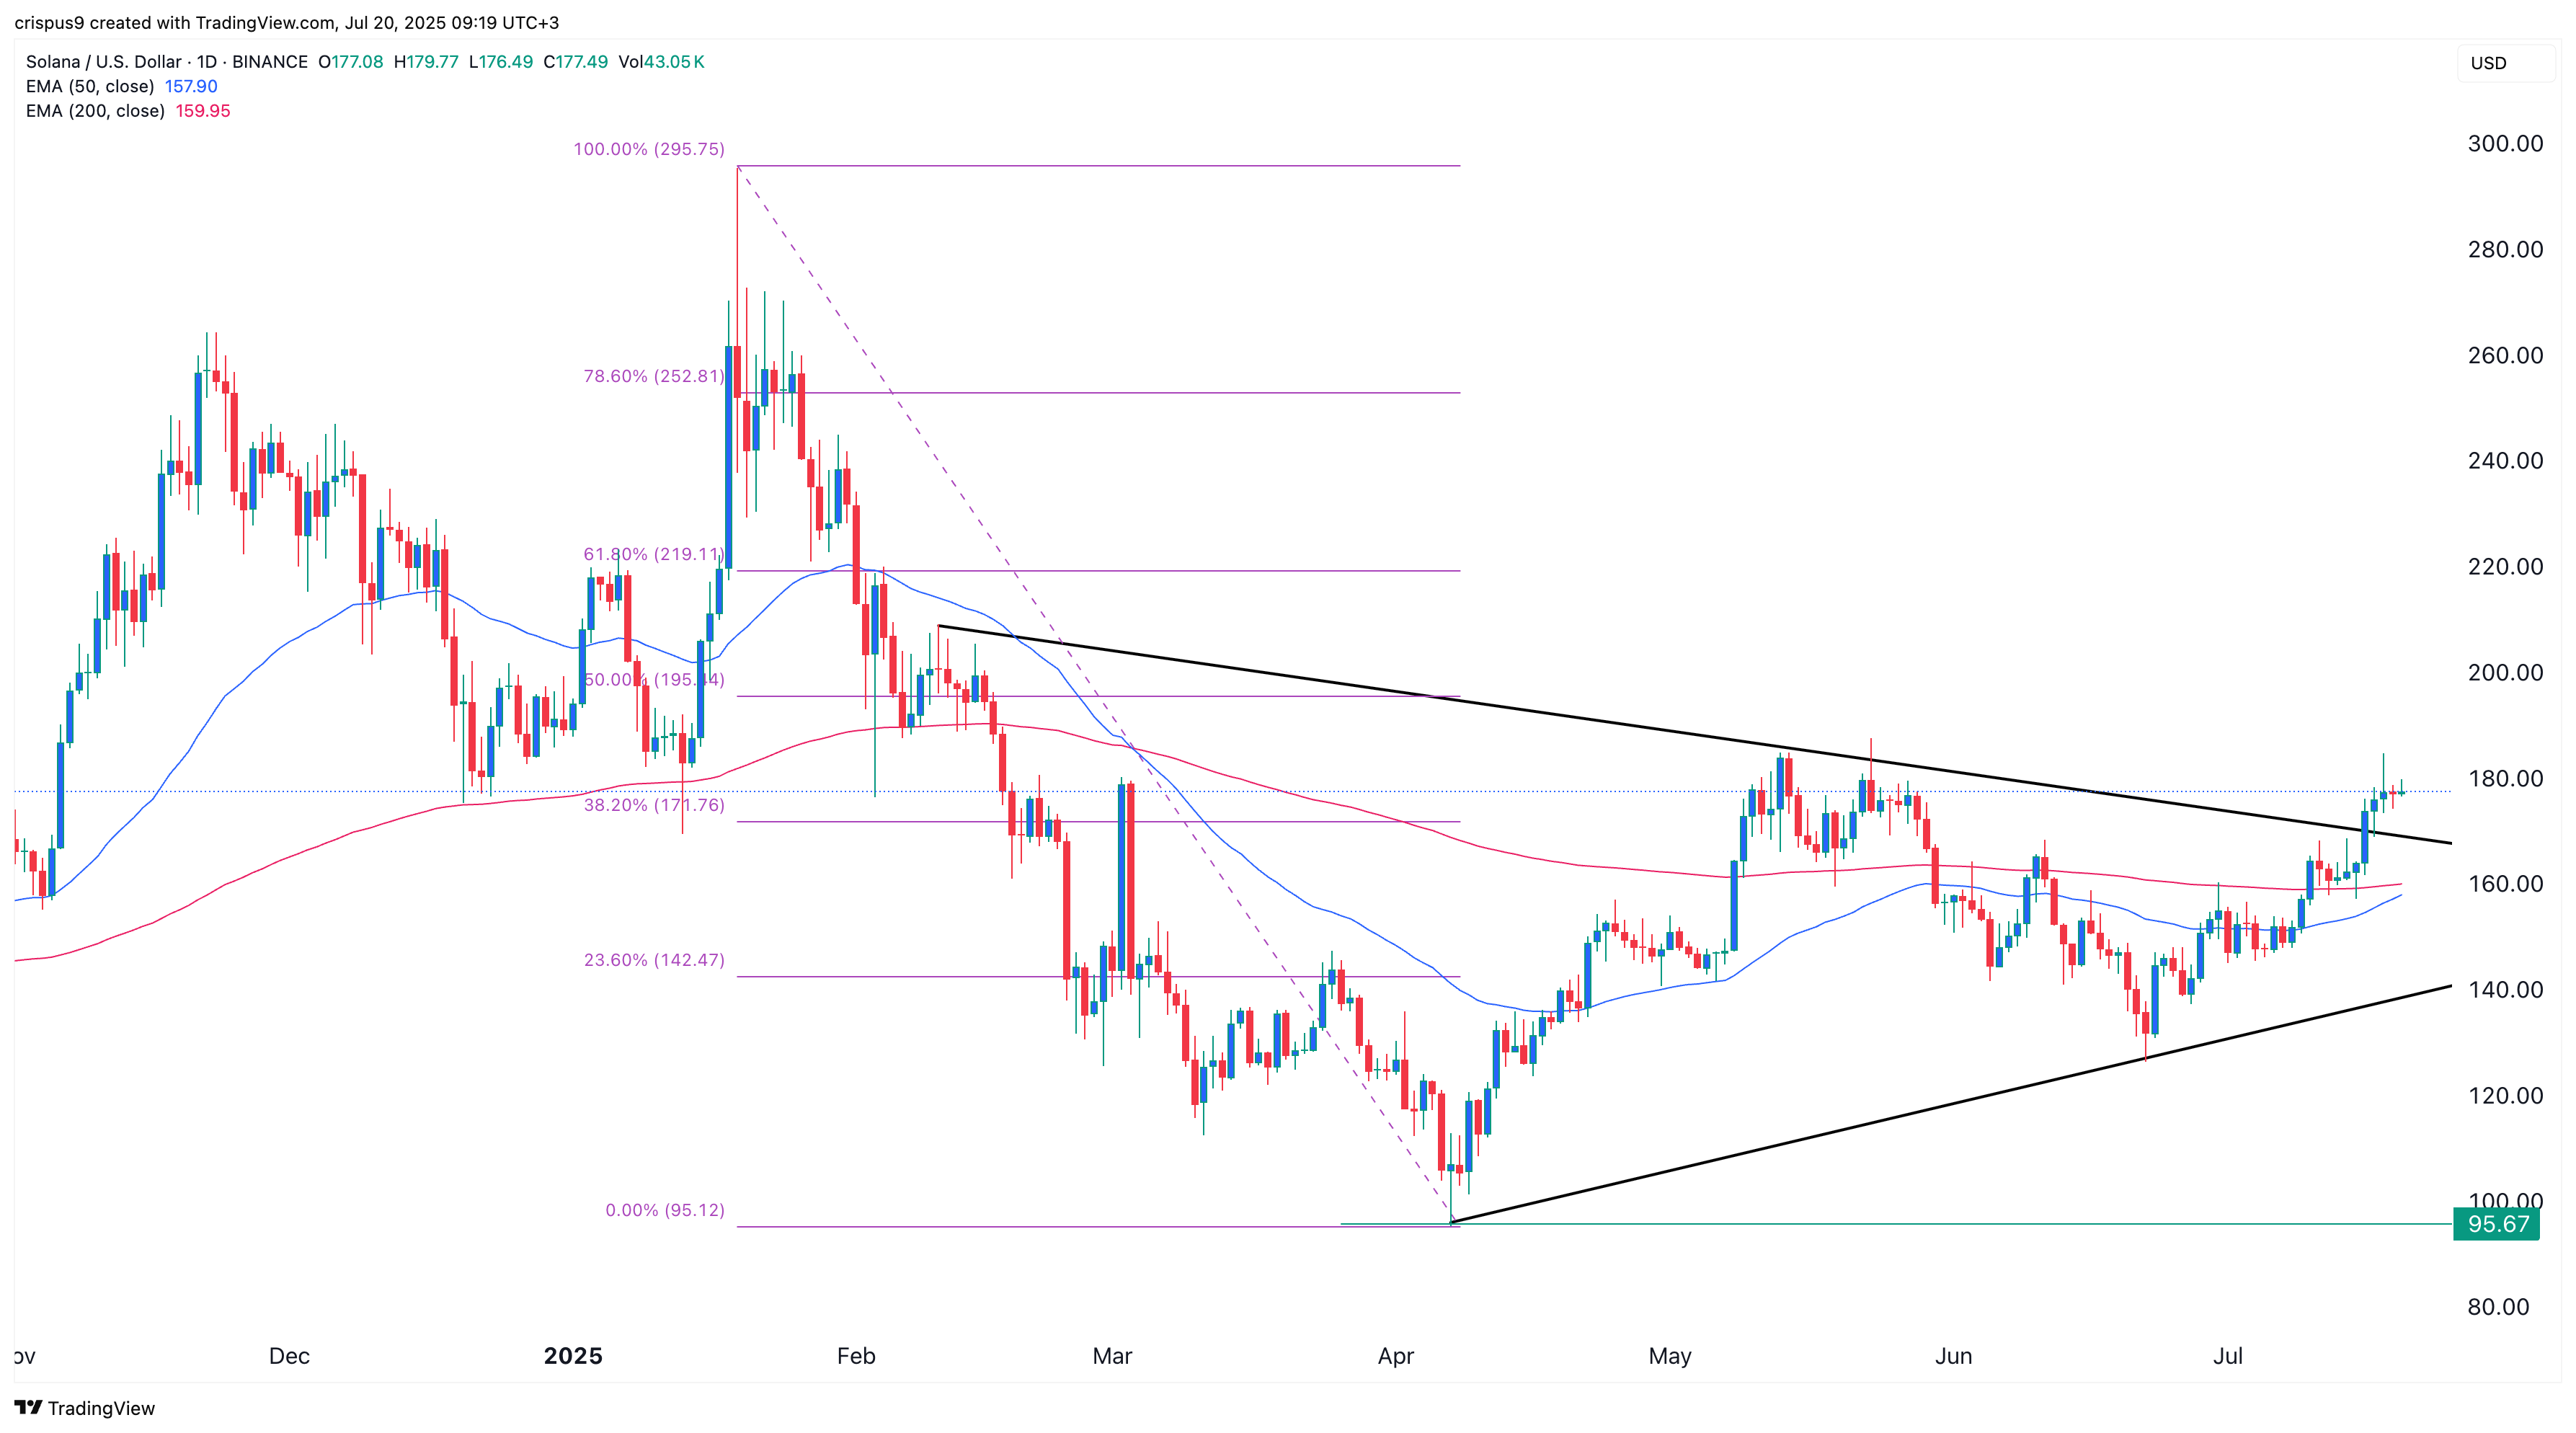
Solana’s price has soared beyond a crucial resistance point, reaching $185, its highest level since May 27. This represents an impressive increase of over 86% from its lowest point this year.
Data shows that the REX-Osprey SOL + Staking ETF has experienced inflows every week since its launch, currently boasting $99.7 million in assets. If this trend persists, the fund is poised to breach the $100 million mark this week.
The SSK ETF stands out by enabling investors to benefit from Solana’s growth while earning passive income through staking rewards. Current data indicates that staked Solana yields an annual return of around 7.5%, making it a compelling option for those seeking dividends.
SSK has allocated 58% of its assets to Solana and 41% to the 21Shares Solana Staking ETP listed in Europe, with the remainder invested in cash and government bonds.
The SSK ETF presents a timely and beneficial option for American institutions aiming to invest in Solana. While it incurs higher costs compared to proposed Solana ETFs, these costs are offset by the potential for monthly staking returns.
Unless the SEC reverses its stance, investments from firms like Franklin Templeton and 21Shares will likely exclude staking features. As a result, investors choosing direct investment in Solana may see better performance compared to those investing via ETFs.
Moreover, Solana’s price surge coincides with the strong performance of several meme coins in its ecosystem, collectively driving their market cap to $15 billion.
SOL Price Technical Analysis

The daily chart indicates that the price has been on a bullish path, recently breaking through the upper boundary of a symmetrical triangle pattern.
Solana’s price is also close to forming a golden cross, as the gap between the 50-day and 200-day moving averages narrows. A golden cross is viewed as one of the most bullish continuation patterns in technical analysis.
Both the Relative Strength Index and the MACD indicators exhibit upward momentum. Thus, it is likely that the token will continue to rise as bulls target the significant resistance level at $200.


